

TL;DR
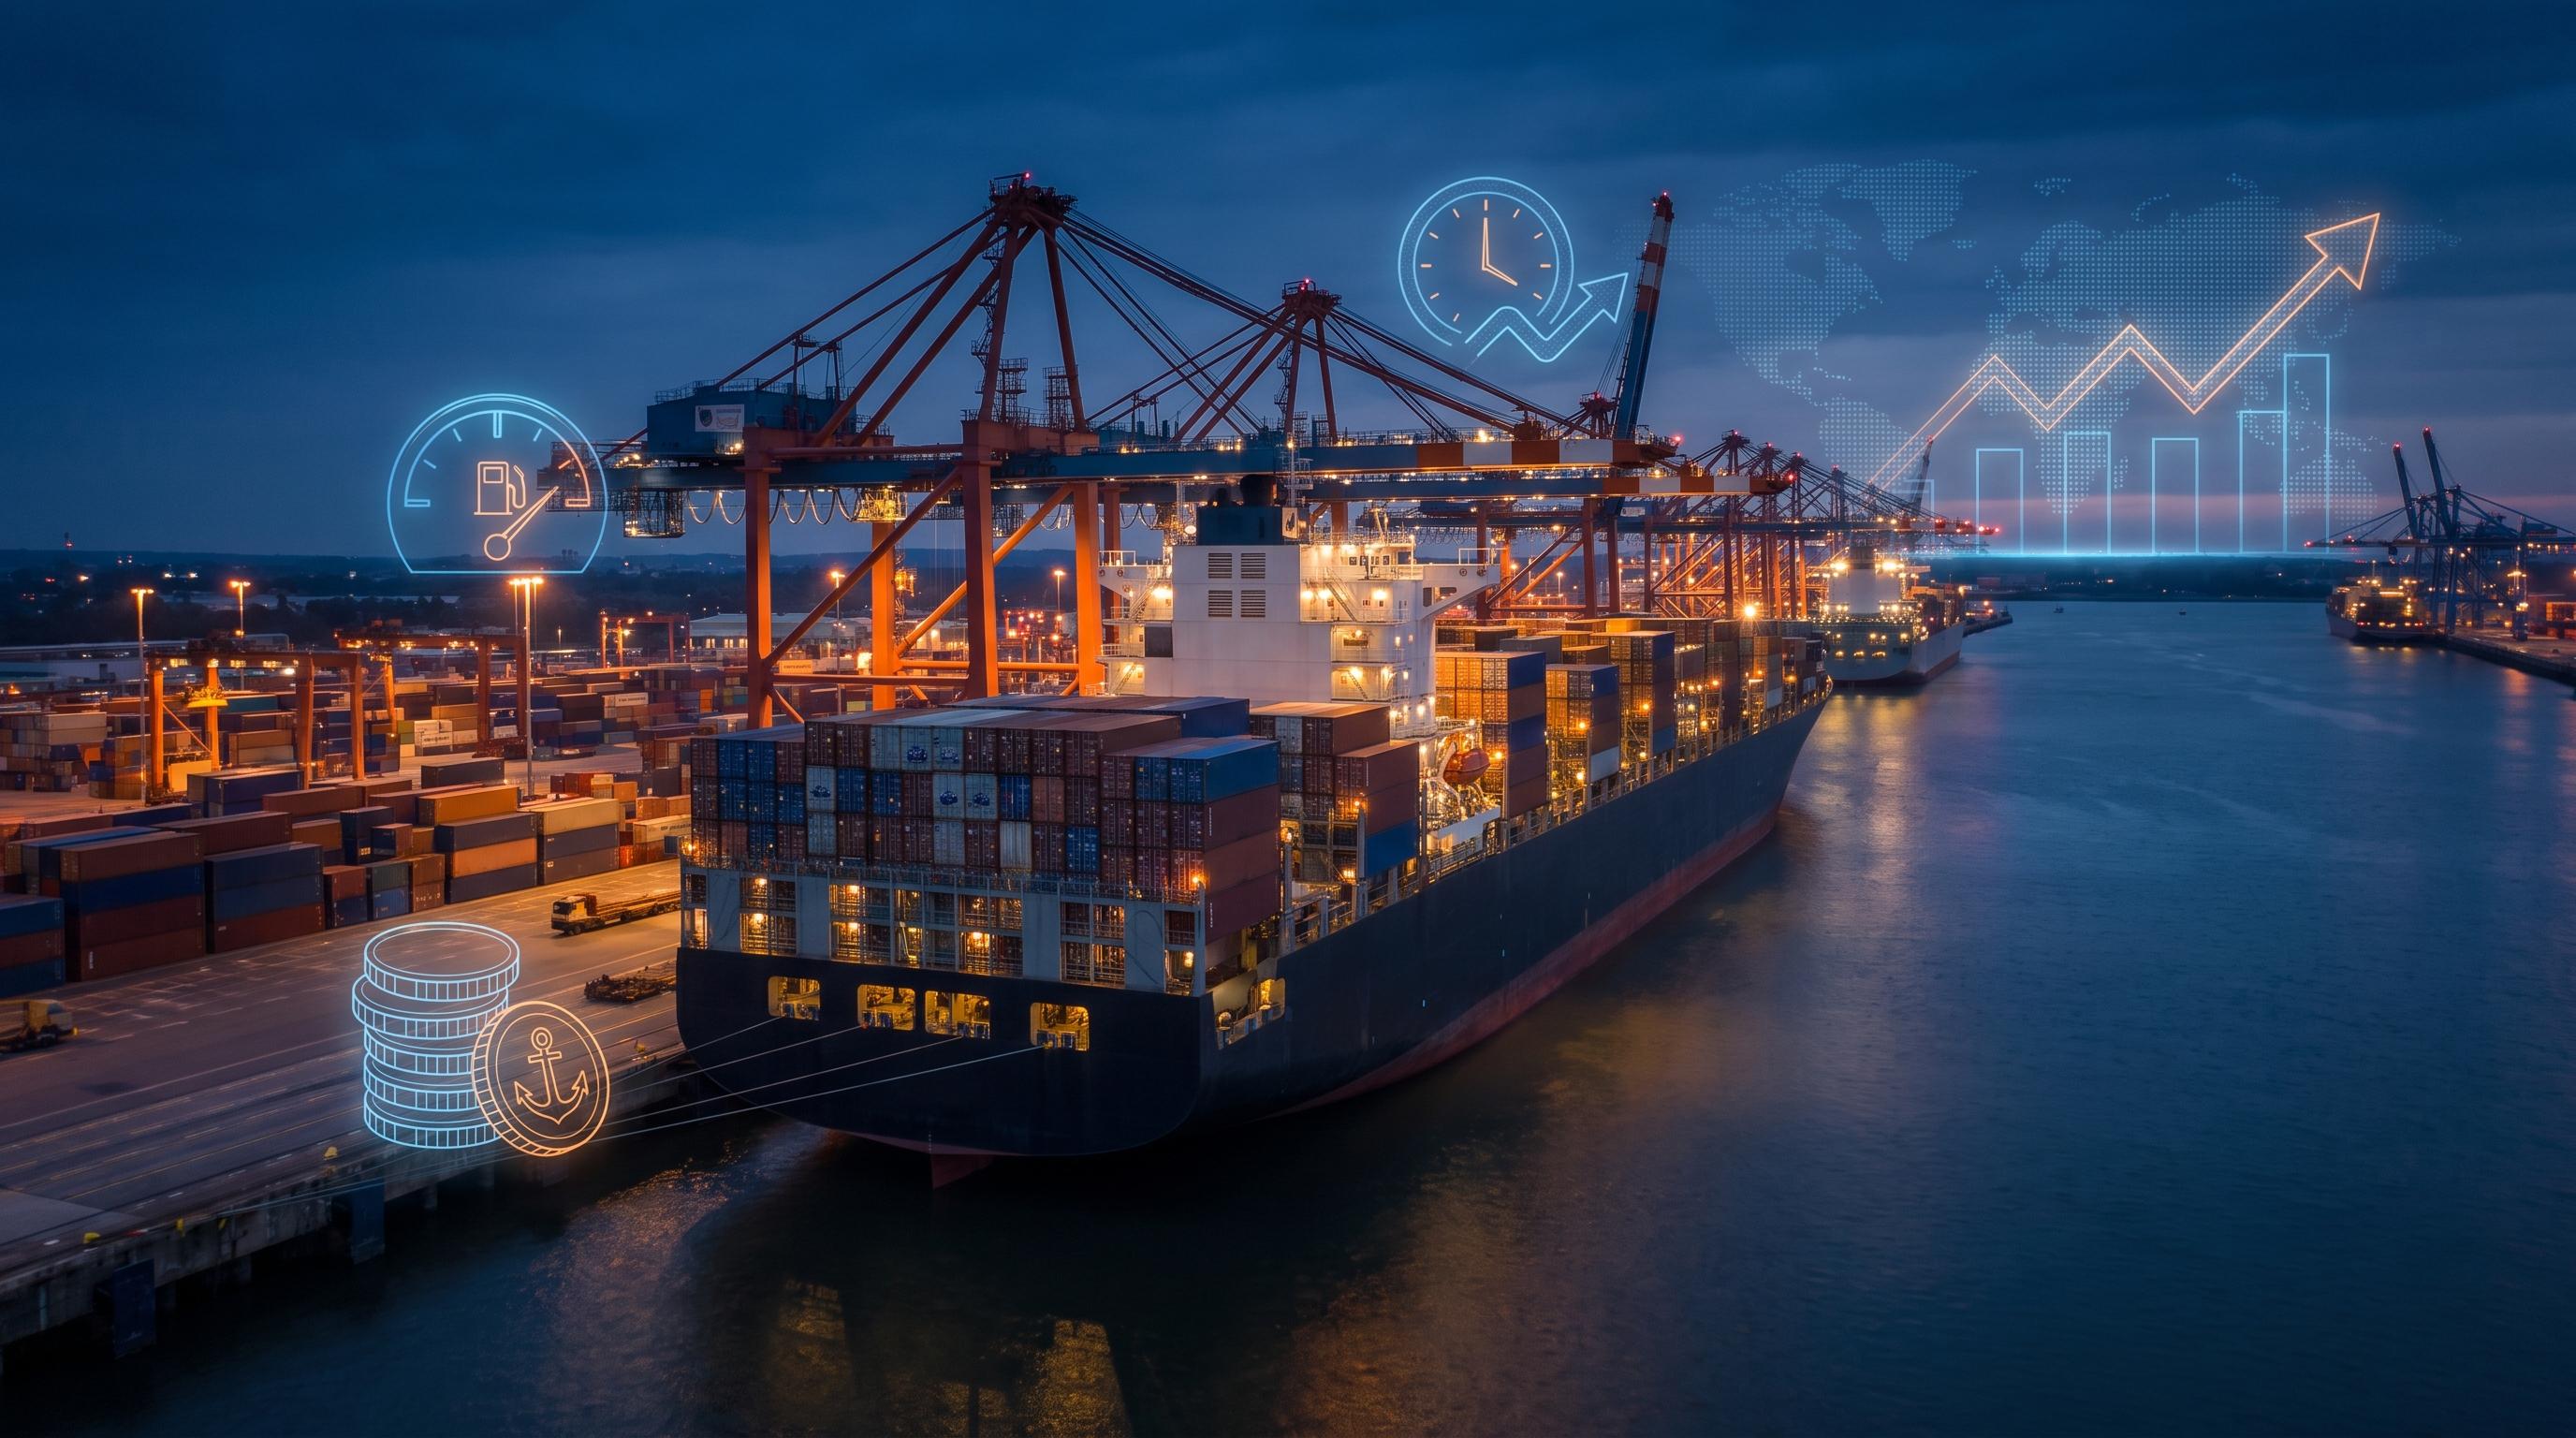
Voyage costing is the process of assigning revenue, direct voyage expenses, vessel time cost, and material post-voyage adjustments to a specific sailing or route. It shows whether a voyage that looked operationally successful actually protected margin once bunker cost, port charges, cargo handling, delay-related cost, overtime, maintenance disruption, and manual rework are included.
Many operators know how much a voyage earns, but not what it costs. A ship can arrive safely and on time while still losing profit. Fuel, port bills, overtime, repairs, and paperwork costs often sit in separate places. By the time they come together, it may be too late to improve the next sailing.
Voyage costing helps operations leaders see how each sailing affects profit. Longer routes can use more fuel, crew time, insurance, or charter fees. Delays can add more costs. Without the full cost for each voyage, teams make route and schedule choices with only part of the picture.
Treat each sailing as a separate job. Add its revenue, direct costs, cost of using the ship, and later adjustments. Link the figures to the voyage, ship, route, dates, cargo, and final bills. Teams can then compare the plan with what happened.
The goal is to show why a route’s costs or earnings changed, while leaders can still respond. They should be able to answer three questions: What did the voyage earn? What did it cost? What changed the result?
A useful view shows the money earned, direct costs, the cost of using the ship, expected refunds or claims, and the gap between plan and final result. This helps teams spot where profit is slipping.
Revenue reports show how much a voyage earned, but not what it cost to run. They may miss fuel burned while waiting, extra crew hours, cargo work, or the final port bill. Those costs can erase profit.
This matters because profitable months can hide weak sailings. One strong voyage can cover several poor ones. A vessel can also look productive in total while one route keeps absorbing delay cost, avoidable port extras, and manual rework.
Reporting area | Revenue-only voyage reporting | True voyage costing |
|---|---|---|
Route profitability | Shows revenue by voyage or route. | Shows contribution and operating margin after direct and vessel-time cost. |
Fuel visibility | May show purchases or a fleet-level fuel total. | Connects bunker or fuel cost and consumption to sailing, port time, and variance. |
Port cost visibility | Often reports port invoices after the fact. | Tracks estimated, committed, accrued, and actual port and terminal charges by call. |
Exception handling | Records delays and incidents as operational notes. | Quantifies the cost of schedule variance, overtime, rework, claims, and disruption. |
Planning confidence | Uses historic revenue and broad averages. | Uses estimate-to-actual performance by route, vessel, port pair, and cargo type. |
Management decision speed | Waits for period-end reconciliations. | Surfaces at-risk voyages and cost drivers while corrective action is still possible. |
The true cost of a shipping operation includes more than supplier and fuel lines. A useful voyage costing model keeps cost layers separate so leaders can see what changed and why.
Direct voyage expenses are costs created by a specific sailing. They often include:
Bunker or fuel cost
Port dues and berth charges
Pilotage, towage, and agency fees
Canal tolls and terminal fees
Cargo handling and inspections
Cleaning, security, commissions, and documentation
Voyage-specific insurance and other direct service charges
If a cost clearly belongs to one voyage, code it there. Do not spread it later through a broad allocation rule.
Vessel time cost is the cost of using a ship for a voyage. Count time at sea, loading, waiting, unloading, route changes, and repositioning. For a chartered ship, include hire. For an owned ship, apply your policy for crew, supplies, insurance, management, repairs, and depreciation.
This is why turnaround time and schedule variance matter financially. A berth delay does not just add port fuel and overtime. It also uses vessel availability that could have supported a revenue-producing movement. The World Bank’s Container Port Performance Index benchmarks port performance using observed vessel time in port.
Some costs support the wider business, not one voyage alone. Shore operations, finance, commercial support, technology, fleet management, and executive overhead belong in a separate allocated layer. Leaders need to see both direct voyage contribution and the fully allocated result used for route strategy and pricing.
The voyages that look healthy on paper often hide variance in fuel, port activity, delays, and manual follow-up. These are the cost areas most likely to distort voyage profitability when systems are disconnected.
Fuel costs depend on its type, price, amount, and when and where the ship uses it. Separate higher prices from extra fuel use; each needs a different fix. Track fuel used at sea, in port, at anchor, during route changes, and for onboard systems.
Compare fuel used with the budget for each voyage and leg. Then check speed, weather, currents, hull condition, port congestion, cargo heating or cooling, and engine use. Monthly purchase totals can hide the cost of one sailing. The IMO’s Ship Energy Efficiency Management Plan guidance covers operational measures and fuel-consumption monitoring.
Early port estimates may miss final charges. The bill may include shifting, launch services, security, waste removal, extra berth time, overtime, or towage. List pilotage, towage, berth, agency, terminal, and cargo handling separately. This shows where the extra cost began: port, cargo, vessel, or schedule.
Schedule variance should leave a clear cost trail. Common drivers include:
Late manifests
Berth unavailability
Cargo readiness issues
Slow loading or discharge
Route changes
Inspections, security events, and weather
These issues can create overtime, extra fuel burn, idle time, claims exposure, and lost vessel availability. Recoveries may offset some of the impact, but a receivable is not the same as healthy operations.
Maintenance can hurt a voyage before the repair bill arrives. A breakdown may delay sailing, require a substitute ship, burn extra fuel, force rebooking, lose cargo, or add overtime. Manual rework also hides costs. When teams keep manifests, port papers, invoices, and spreadsheets apart, leaders learn what happened too late to prevent a repeat.
Before each sailing, teams can use a review to confirm route assumptions, expected costs, operational risks, and missing information. That preparation helps surface avoidable surprises before they affect voyage performance.
A useful voyage costing process keeps four numbers visible at the same time. If teams confuse them, they create false confidence and delay action.
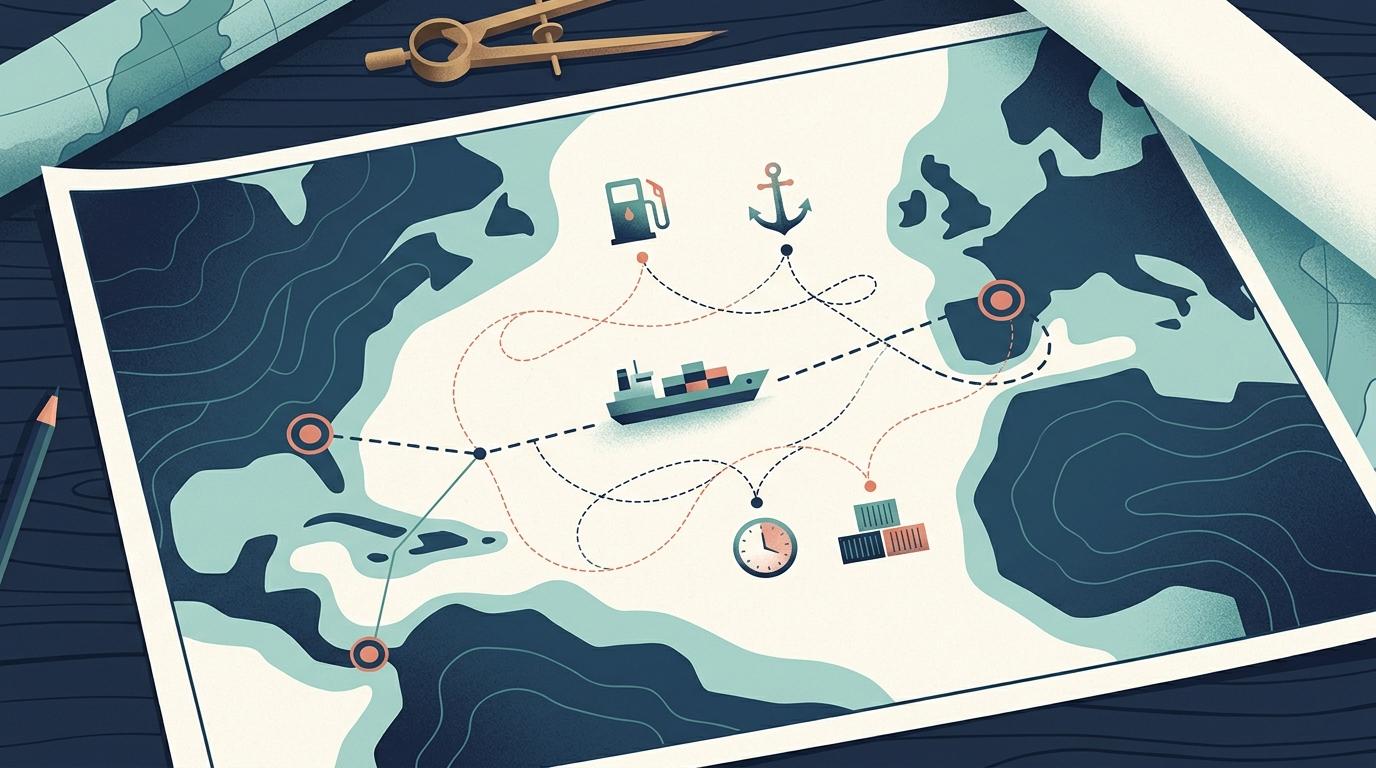
Estimate : What should this voyage earn and cost under the approved operating plan?
Committed cost : What approved bookings, service orders, port estimates, and contractual obligations are already expected?
Accrued cost : What has been incurred operationally but has not yet arrived as a final supplier charge?
Actual cost : What has been invoiced, reconciled, and assigned to the voyage?
A voyage may seem profitable when cargo is unloaded because some bills have not arrived yet. Estimate the final total, including costs still to come. Keep the voyage open until teams check fuel, cargo amounts, port bills, commissions, claims, and expected costs.
Start with voyage revenue: freight, passenger, vehicle, cargo, surcharges, and recoveries. Subtract rebates, commissions, credits, and claims, then direct voyage costs. The result is direct contribution. Next subtract vessel time cost to find the operating result. Show shared fleet and company costs separately for a fully allocated view.
Voyage operating result = voyage revenue − direct voyage expenses − vessel time cost.
Keep ballast and waiting time consistent in every route view, or comparisons across voyages will overstate some margins and understate others.
Treat commissions, credits, claims, and recoveries the same way across reports so the route result means the same thing every time leadership reviews it.
Use one policy for repositioning and vessel-time cost so contribution per voyage day, fuel cost per nautical mile, and route margin remain useful for decisions.
ERP helps operators connect voyage execution with cost visibility. It does not replace specialist maritime, scheduling, or port systems by default. Its role is to provide the controlled reporting and financial layer that ties voyage events to procurement, billing, accruals, approvals, and analysis.
Put one voyage reference on each transaction line. Link it to the ship, voyage leg, port call, route, cargo, customer, contract, company, and cost center. Then fuel receipts, supplier charges, purchase orders, invoices, commissions, claims, and adjustments can be traced to the same voyage. Without this link, costs scatter across logs and late spreadsheets.
Link voyage costs, supplier bills, and operating events to the same sailing. Then leaders can explain route results sooner and act before losses repeat. This is vital when a route crosses companies or currencies. If costs, recoveries, and settlements are split across reports, results take longer to review and improve.
A focused conversation can help your team connect voyage events with cost data, pinpoint reporting gaps, and clarify which visibility improvements could support faster decisions and stronger route margin planning.
A voyage dashboard should flag weak routes before the next sailing. Show planned, committed, accrued, invoiced, and expected final revenue and costs. Include direct contribution, vessel time cost, operating margin, fuel and schedule differences, unpaid bills, and days since the voyage ended.
What the dashboard should explain first
Movement in freight, passenger, or cargo revenue
Fuel price variance versus fuel consumption variance
Voyage-day movement driven by delay, waiting, or turnaround slippage
Port, terminal, cargo-handling, overtime, and claims movement
Which vessels, routes, port pairs, cargo types, and customers drive the variance
The value of this reporting is speed. Leaders should be able to move from the route view to the voyage, then to the fuel event, port call, supplier charge, or exception that changed margin, while the pattern is still operationally useful.
Before treating a route as healthy, leadership should be able to see the full voyage-cost picture:
Approved route, voyage, and vessel plan
Planned versus actual sailing time and turnaround time
Manifest or cargo quantity, billable revenue, surcharges, commissions, credits, claims, and expected recoveries
Fuel purchased, remaining on board, consumed by grade and operating condition, and budget-versus-actual fuel cost
Port charges, terminal fees, agency, pilotage, towage, canal tolls, and cargo-handling lines
Overtime, waiting time, anchorage time, delay-related cost, and responsibility for each material exception
Maintenance-related disruption, substitute arrangements, rebookings, and the cost or revenue effect
Open commitments, missing supplier bills, unreconciled bunker consumption, unbilled revenue, and material accruals
Direct contribution, vessel time cost, operating result, fully allocated result, and estimate-to-actual variance
Manual rework created by disconnected manifests, documentation, coding, or reconciliation steps
Revenue can hide weak sailings. Voyage costing shows whether a voyage protected margin after fuel, port, delay, cargo-handling, and labor cost are included.
Operations leaders need voyage costing because route planning, vessel deployment, turnaround targets, and schedule decisions all depend on real cost visibility.
The biggest sources of hidden leakage are usually fuel variance, port extras, schedule disruption, overtime, maintenance events, and manual rework.
The strongest voyage view keeps estimate, committed cost, accrued cost, and actual cost visible at the same time.
A route is only healthy when leadership can explain the final result by vessel, port call, cargo pattern, delay event, and cost driver.
ERP adds value when it ties voyage events, supplier charges, claims, accruals, and reporting back to the same sailing.
Voyage costing is the voyage-level view of revenue, direct operating cost, vessel time cost, and material adjustments for a specific sailing. It shows whether a route that generated revenue also protected margin once fuel, port charges, cargo handling, delay cost, and other exceptions are included.
Shipping operators struggle because the cost picture is split across fuel logs, port agents, manifests, overtime records, maintenance events, procurement, and finance reconciliations. By the time final charges arrive, the voyage can look healthier than it really was, which delays corrective action and hides recurring margin leakage.
The costs most often missed are waiting-time fuel, port and terminal extras, cargo handling, overtime, vessel time cost, maintenance disruption, commissions, claims, and manual rework. Those omissions matter because they can turn an apparently healthy sailing into a weak-margin voyage.
Voyage costing improves route decisions by showing which sailings, ports, cargo patterns, and service conditions actually produce contribution after their real operating cost. That lets leaders adjust pricing, scheduling, turnaround targets, and vessel deployment using route-level evidence rather than revenue alone.
Yes. ERP can connect voyage events with procurement, billing, accruals, claims, and reporting when transactions share a consistent voyage, vessel, route, and port-call structure. That gives operations and finance one view of the same sailing instead of separate records that are reconciled too late.
They stop being enough when teams are reconciling multiple spreadsheets after each voyage, costs regularly post without a voyage reference, final charges materially change historical margin, or management cannot explain route variance before the next sailing decision.
No. Demurrage or other recovery may offset part of a delay, but it does not automatically make the voyage healthy. Leaders should compare expected and collected recovery with the full time, fuel, port, emissions, and opportunity cost created by the event.
Softype is an Oracle NetSuite solution provider with more than 25 years of experience and over 600 implementations. We help maritime and ferry operators connect voyage execution with cost visibility so that fuel, port charges, delay cost, overtime, and recoveries land against the same sailing ID and leaders can see estimate, committed, accrued, and actual cost before the next departure decision.
If you want to map the cost, delay, and reporting gaps behind your current sailings, review your process against the Pre-Departure Voyage Visibility Checklist or book a short working session. We can help identify where route margin is leaking today and what a clearer voyage-level view would look like for your fleet.


Helping businesses thrive with integrated ERP solutions.
NetSuite
Service
Company
Contact Us
Copyright © 2026


