


A chain can see sales by store and still not know which locations are performing well. One branch may post higher revenue after deep discounts, more returns, or stockouts on best sellers. Another may sell less but protect gross margin and keep key items available. Multi-branch retail management means looking at those drivers together, not ranking stores by sales alone.
A useful multi-branch view connects net sales, returns, discounts, cost of goods, stock position and movement, and store expenses under consistent reporting rules. This helps leaders investigate differences in margin, availability, and stock health. Store targets should still reflect location, format, maturity, and local trading conditions.
Sales alone cannot show whether a branch is performing well. POS reports capture transactions and discounts. Inventory reports may arrive separately, while finance may finalize cost of goods sold (COGS) after the period closes. Different cut-off dates or definitions can make a comparison look precise while hiding gaps.
Disconnected reports make leaders slow to spot what is driving a store’s result. A finance director may see margin fall but lack a timely link to markdowns, returns, shrinkage, or a changed item cost. An operations director may see low sales without knowing whether demand weakened or priority stock ran out. Until sales, stock, and cost use the same store, item, and period definitions, leaders cannot confidently separate a trading issue from a reporting gap.
A shared view needs the same item, location, sale, return, transfer, adjustment, and cost definitions across branches. It should retain enough detail to move from an outcome, such as a margin decline, to its likely drivers without waiting for a spreadsheet consolidation after the decision window.
A connected view makes store comparisons faster to trust and more useful for action.
Measure | Separate store reports | Connected store-performance view |
|---|---|---|
Sales visibility | Gross sales totals; returns and discounts reconciled later | Net sales with returns and discounts shown by store and period |
Stock accuracy | One on-hand figure, often checked during counts | On-hand split into available, committed, in transit, and non-sellable |
Margin comparison | Estimated from revenue with uneven costing timing | COGS, gross profit, and margin under one documented method |
Exception detection | Found by manually reviewing each report | Stockouts, overdue transfers, adjustments, and margin variances flagged |
Replenishment decisions | Reorder because one branch appears low | Compare network demand and stock before replenishing or transferring |
Reporting speed | Days or weeks to consolidate and reconcile | Refresh time and financial cut-off stated on the report |
A trusted view brings together four related lenses: sales, stock, margin, and store economics. Sales include units, realised price, discounts, returns, and the transaction date. Stock distinguishes available quantities from committed, in-transit, damaged, and on-order units. Margin joins the sale to the applicable product cost. Store economics adds expenses such as occupancy and payroll without confusing them with COGS.
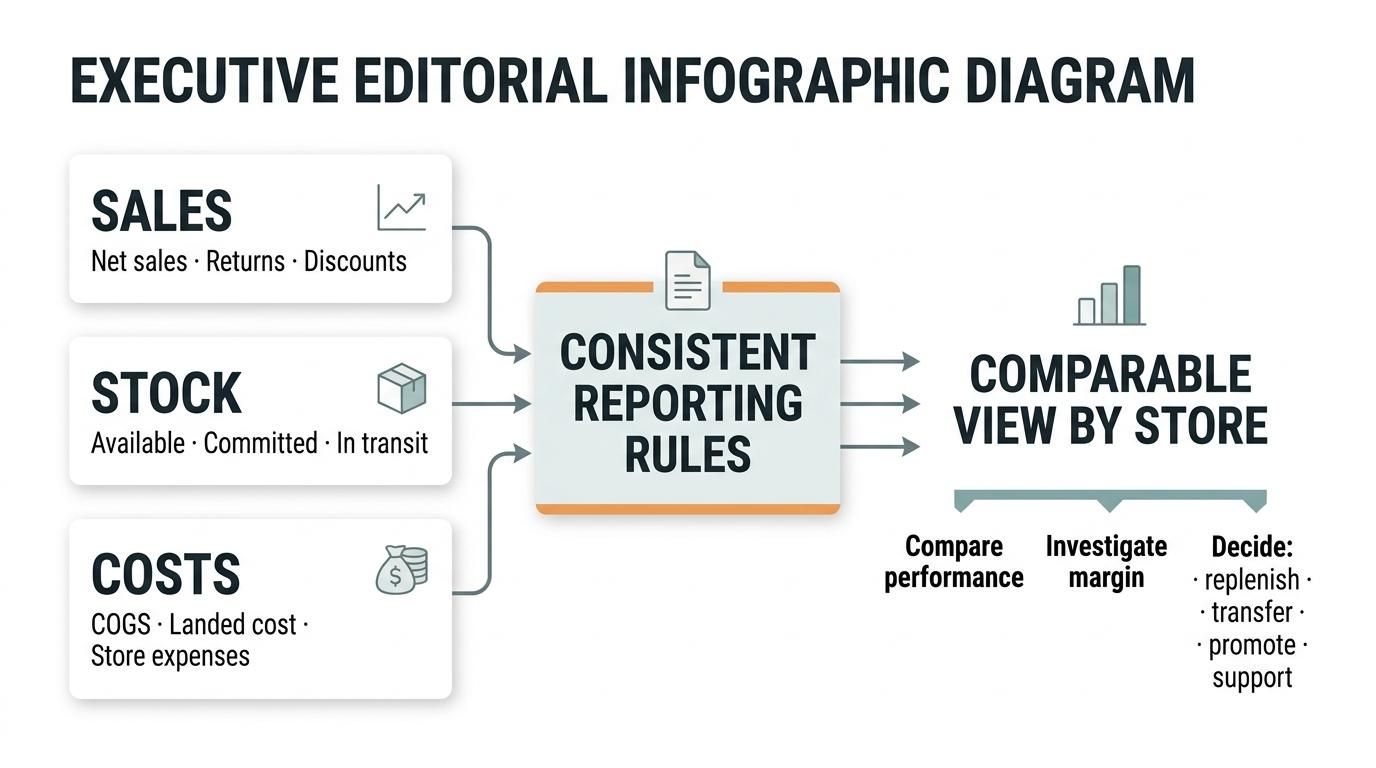
Store comparisons are only useful when reporting rules match. Agree whether net sales exclude tax, when returns affect the period, how markdowns and supplier-funded promotions are treated, and which costing method values stock. IAS 2 from the IFRS Foundation outlines inventory cost assignment and when inventory cost is recognized as an expense. Microsoft's guide to costing methods explains how costing methods value stock decreases. Also document how freight or landed costs enter product cost and which expenses sit below gross margin. If costs are not final, label them as provisional.
Record every stock movement with its origin, destination, quantity, date, and reason. Oracle NetSuite's transfer-order guidance explains how to track stock in transit until the receiving store gets it. Do not count it as sellable at the destination before receipt. Keep a clear trail for counts and adjustments so teams can investigate shrinkage, damage, and repeat variances instead of routinely clearing them. A 2026 grocery-retail inventory study reviewed about 24,000 SKUs across 11 stores. It links record inaccuracy with stock levels, restocking frequency, and perishability. In its field audit, stock counts were followed by an 11% store-wide sales lift, concentrated in items where recorded stock exceeded physical stock.
After aligning those reporting rules, ERP for Retail explains how connected store, inventory, and finance information can support consistent reporting. For a separate discussion of branch-to-head-office workflows, see Branch-to-HQ Control in Philippine Retail.
For a practical way to check whether your store reviews connect sales, stock, and margin, use the Retail Margin & Compliance Scorecard.
A margin variance is a prompt to investigate, not proof of poor store management. Compare net sales, units, average selling price, discount rate, return rate, COGS, gross profit, and gross-margin percentage. Where reliable data is available, add directly attributable store expenses and show contribution separately from gross margin. Microsoft's Sales by Location report is one example of location-based sales, quantity, cost, and profit analysis.
Then test possible explanations at store, category, and SKU level. A margin decline may reflect a shift toward lower-margin products, increased markdowns, supplier cost changes, refunds, shrinkage, or missing cost updates. If the same item shows an abrupt margin change across many stores, the cause may be a shared price or cost issue rather than local execution.
Compare sellable stock with local demand before deciding to buy more. A store may be losing sales on priority items while another holds ageing units. Review stock on hand alongside committed, in-transit, and non-sellable quantities, then compare sell-through, stock turns, days of supply, and transfer status. This lets operations weigh replenishment against a transfer, while finance can see the cash and margin trade-offs before the team acts.
Promotions also need context. A sales lift can come with lower gross profit, more returns, or stockouts elsewhere. Reviewing discount depth, sell-through, margin, and availability together helps teams assess the trade-off rather than treating promotional revenue as proof of success.
Use common definitions, but assess each branch against its operating context. Location, format, catchment, maturity, trading hours, and local costs shape what a store can deliver. A mall branch, neighborhood shop, and outlet may need different assortments and expectations. For a COO or finance leader, the aim is not one identical target; it is a comparable view that shows which differences need investigation and which reflect the store’s role.
The following simplified example illustrates how the view changes the conversation; it is not a benchmark. South leads on net sales, but its lower gross margin, higher discount rate, more stockouts, and older inventory call for investigation.
Same week | Branch North | Branch South |
|---|---|---|
Net sales | ₱1,000,000 | ₱1,040,000 |
COGS | ₱580,000 | ₱710,000 |
Gross margin | ₱420,000 (42.0%) | ₱330,000 (31.7%) |
Discount and markdown rate | 4% | 14% |
Top-seller stockout rate | 2% | 10% |
Aged inventory value | ₱180,000 | ₱460,000 |
The right next step is not automatically to cut South’s stock or ban discounts. Review its assortment, demand, price execution, returns, and cost data, then account for its location and format before choosing support or targets.
Review the measures together for a consistent period, using the same reporting rules at each branch.
Net sales, units, and sales by store, SKU, category, promotion, and day.
Returns and refunds, including selling location and processing location.
Discounts and markdowns, with reason codes and promotion context.
COGS, gross profit, gross margin, and the costing method used.
On-hand, available, committed, in-transit, on-order, and non-sellable stock.
Transfers by status, including requested, dispatched, received, overdue, short, or disputed.
Stockouts, sell-through, stock turns, days of supply, and aged inventory.
Shrinkage, damage, write-offs, and stock-count variance with follow-up causes.
Store expenses such as occupancy, payroll, utilities, delivery, and local marketing, with allocation rules stated.
Also show the report’s refresh time and financial cut-off. These details help leaders distinguish a trading issue from a late posting or an incomplete reconciliation.
Compare net sales, returns, discounts, COGS, gross profit, margin percentage, stock availability, sell-through, stock turns, shrinkage, and relevant store expenses. Use common definitions and periods, then interpret results in each location’s format and operating context.
Sales alone cannot show whether a store’s results are commercially healthy. Discounts, returns, product mix, stockouts, shrinkage, and store expenses can make branches with similar revenue perform very differently.
Link each sale and return to its store, item, realised price, and applicable cost, then apply one documented costing method consistently. Report gross profit and margin by branch and product, and flag provisional or adjusted costs.
Inventory visibility helps protect store profitability by showing which stock is sellable, committed, in transit, or non-sellable. That context helps teams avoid false availability and unnecessary reorders, and supports timely replenishment or transfers to limit stockouts and markdown pressure.
Store-margin differences can reflect product mix, discounts, markdowns, returns, shrinkage, supplier cost changes, landed-cost treatment, or missing and stale costs. Inconsistent reporting cut-offs or costing timing can also create apparent differences unrelated to store trading.
Standardize reporting periods, sales definitions, item hierarchies, and costing treatment, but set expectations for each store’s context. Consider location, format, maturity, catchment, and local cost structure rather than applying identical targets to every branch.
No. Gross margin is net sales less product cost; store profitability also accounts for operating costs such as rent and payroll. Keep the measures distinct and make the expense-allocation basis visible.
A connected retail view helps leaders see where demand sits, where stock is tied up, and whether sales are producing the intended margin. Consistent measures make it easier to spot questions worth investigating across stores without treating every location as if it had the same format, costs, or trading conditions.


Helping businesses thrive with integrated ERP solutions.
NetSuite
Service
Company
Contact Us
Copyright © 2026


