

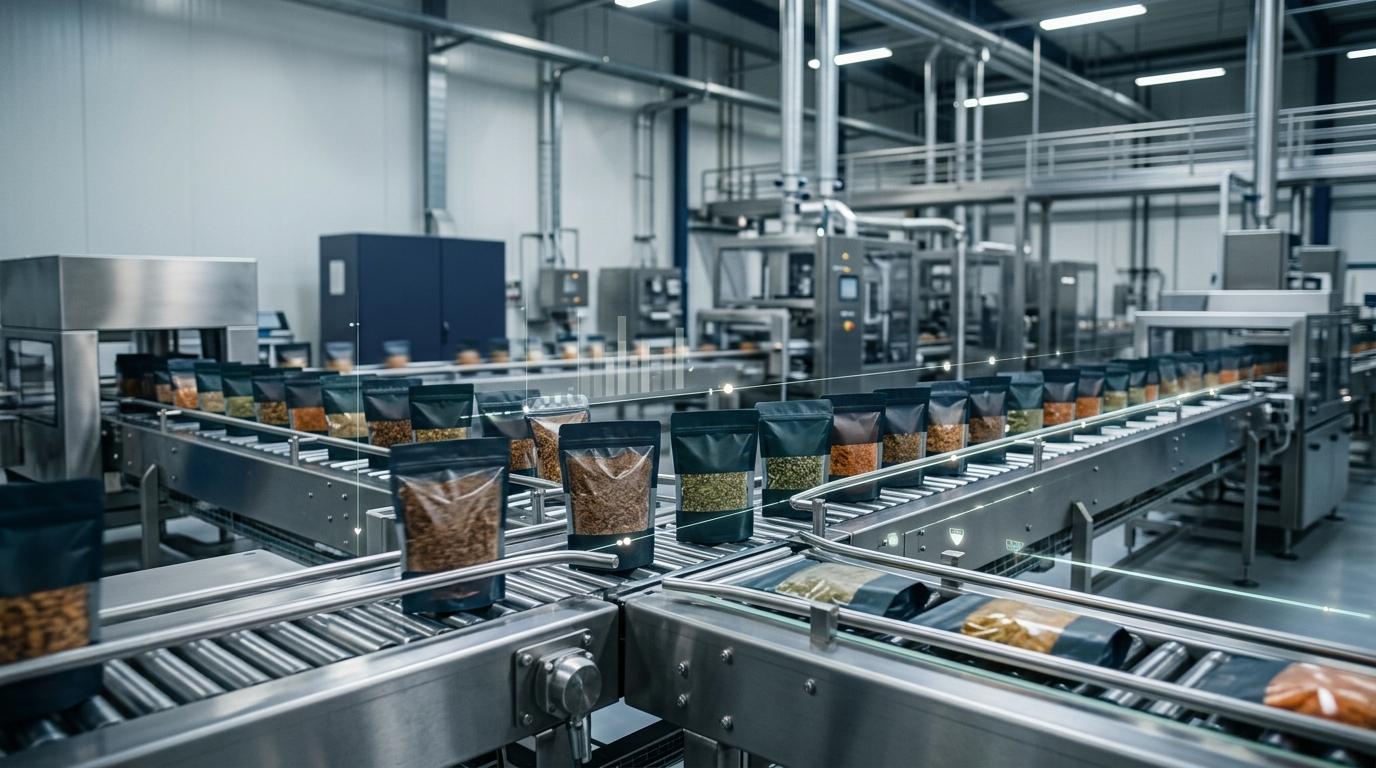
A food SKU can keep selling while its margin quietly erodes. Ingredient prices rise, packaging changes, production yield slips, or a customer discount grows, while the sales report still looks healthy. Start with Softype’s food ERP buyer checklist as a practical guide to evaluating the processes behind reliable cost visibility.
For finance leaders, the challenge is not just knowing revenue and standard cost. It is understanding what a specific run consumed, what saleable quantity it produced, what the customer actually paid, and which assumptions remain provisional. Without that context, product comparisons can mislead pricing, production, and portfolio decisions.
Answer capsule: Food manufacturing cost and margin visibility connects a SKU’s realized selling price to its current recipe, ingredient and packaging inputs, batch production, good-unit yield, labor, and absorbed overhead. Finance compares expected costs with recorded activity, then traces variances to the run or transaction that caused them. During the month, this can be a timely operating estimate; finalized accounting costs may come later.
The distinction matters. Standard cost is a benchmark built on defined assumptions. Actual cost reflects recorded transactions and the business’s costing method. Neither number is useful without knowing its basis, effective date, included costs, and whether production or accounting close has finalized it.
A standard cost answers, “What should this product cost under the assumptions we approved?” It supports planning and variance analysis, but it can become stale when the inputs behind it change. IFRS guidance on inventory costing says standard costs should reflect normal levels of materials, labor, efficiency, and capacity use, and be reviewed in light of current conditions.
A periodic spreadsheet review adds a timing gap. Purchasing may receive higher-priced ingredients, production may run several batches, and freight or supplier invoices may arrive before finance updates the model. The next month’s revised unit cost cannot explain a specific run unless its material issues, output, scrap, and cost treatment are captured and connected.
Averages can also hide outliers. If several batches run near plan but one has unusually low yield, a monthly average may point to a modest cost increase while obscuring the run that needs investigation. A connected view should make it possible to move from the SKU to relevant batches, cost drivers, and commercial transactions, not just show a margin percentage.
Review dimension | Periodic standard-cost review | Connected SKU cost and margin visibility |
|---|---|---|
Ingredient cost | Uses assumptions refreshed at review intervals | Compares current purchase or landed cost with the benchmark |
Packaging | May retain an earlier component or supplier rate | Tracks pack specification and recorded packaging use |
Yield variance | May rely on expected yield until actuals are gathered | Compares expected output with good units and reported loss |
Production cost | Applies planned labor and overhead assumptions | Uses captured production activity under the chosen costing method |
Margin timeliness | Often refreshed after period-end reconciliation | Updates as transactions arrive; estimates may precede final cost |
Variance investigation | Requires reconciling separate files and reports | Traces the variance to batches, receipts, material issues, or sales deductions |
For a CFO or Controller deciding whether to reprice, start with the latest comparable production run and bridge standard cost to recorded cost: ingredient rate and usage, packaging, yield or scrap, and labor or overhead. Then compare that cost with net realized selling price after discounts. If invoices or production close are outstanding, treat the result as an estimate—not the sole basis for a price change.
SKU profitability depends on the factors that convert ingredients into saleable goods and, for some analyses, the terms under which those goods are sold. The costing policy should make clear which costs are part of manufacturing cost and which are commercial deductions below gross margin.

Recipe inputs and usage. A recipe or formula sets the expected materials and quantities. Compare the effective recipe version with the ingredients actually issued. A higher supplier price is a material-rate variance; excess consumption against the formula is a usage variance. Approved substitutions should be recorded against the batch because they can change cost even when the finished SKU name stays the same.
Packaging. Different pack sizes can use a shared food formula but require distinct bottles, pouches, labels, cartons, trays, or secondary packaging. Packaging prices and usage should be linked to the finished SKU and relevant production run rather than blended across unlike products.
Labor and overhead absorption. Preparation, processing, filling, inspection, cleaning, and packing consume labor and capacity. Overtime, changeovers, or longer-than-planned line time can raise cost per good unit. Cost of goods manufactured may also include production overhead such as utilities, maintenance, depreciation, supervision, or indirect labor. The allocation basis—such as labor or machine hours—should be documented before comparing products.
Yield, scrap, and rework. Yield variance is the difference between expected and actual good output. Moisture loss, evaporation, trimming, spillage, overfill, breakage, rejected product, or rework can mean similar batch inputs produce fewer saleable units. Record expected process loss separately from abnormal scrap where the costing model allows, so a routine process characteristic does not mask an exception.
Inbound costs and selling terms. Depending on policy, the acquired cost of an ingredient may include freight-in, duties, insurance, or handling. Separately, discounts, rebates, returns, and channel charges reduce realized commercial return. Keep these effects distinguishable: a customer discount changes net selling price, not the batch’s manufacturing cost.
For a broader look at process and formula requirements, see NetSuite for Food Processing: A Sub-Vertical Architecture Guide. For recipe versions and production consistency, read From Recipe to Results: NetSuite ERP Streamlines Recipe Management and Product Consistency.
Illustrative example only; the figures are not industry benchmarks. Assume a product sells for $100 per unit and its standard manufacturing cost is $65. The expected gross profit is $35, or 35% of sales.
For a recent run, suppose the ingredient price increase adds $3 per good unit and lower-than-expected yield adds $2.50. If all other manufacturing costs and the selling price remain unchanged, the indicative cost becomes $70.50. Gross profit becomes $29.50, or 29.5% of sales.
The two changes call for different investigations. Purchasing can review supplier pricing and landed cost; operations can examine actual output, process loss, or reject rates. If the sale also receives a $4 discount, net revenue is $96 and indicative gross profit is $25.50, about 26.6% of net sales. The discount belongs in the commercial calculation, not the batch cost.
This is a management illustration, not a claim that the latest batch cost is instantly the finalized accounting cost of every unit sold. Inventory valuation, cost flow, transaction timing, and work-order close can affect the final amount.
Useful margin analysis depends on connecting operational events to the SKU and its financial treatment. The recipe defines expected consumption; purchasing records prices and receipts; production records material issues, substitutions, labor, output, and scrap; inventory tracks the relevant lots and movements; sales records realized price, discounts, and customer or channel context. Finance applies the approved costing method to inventory, cost of goods sold, and gross margin.
That connected trail helps distinguish a purchase-price change from excess material use, a yield problem from a packaging issue, and production cost from a sales promotion. It also gives finance and operations a common starting point: the affected SKU, batch, ingredient, production activity, or sales transaction.
“Real-time” should mean the latest captured transactions feed an operating view without waiting for a manual month-end rebuild. It does not guarantee instant final actual cost. Vendor invoices, inbound charges, overhead allocations, or work-order close may arrive later. Label in-period results as provisional or indicative, show their as-of basis, and reconcile them to finalized accounting costs.
More information about Softype’s ERP for Food & Beverage is available separately; the decision here remains how to interpret a particular SKU’s costs, yield, and margin.
Before comparing a SKU with its prior period, another product, or a target, confirm that the analysis has the context to support a fair comparison:
Current, effective recipe version and any approved substitutions.
Ingredient and packaging costs, quantities, units of measure, and relevant inbound costs.
Production quantities, batch identifiers, and completed good-unit output.
Actual yield, expected yield, scrap, process loss, rejects, and rework.
Production labor treatment and the method used for overhead absorption.
Selling price, discounts, rebates, credits, and net realized revenue.
Channel, customer, pack size, promotion, and relevant delivery context.
Costing method, reporting period, and whether costs are provisional or finalized.
Comparison requires consistent definitions and operating context. Before ranking SKUs, segment or qualify results by pack size, channel, customer terms, and production run size; then compare like-for-like margins using the same cost basis and period. A retail pack sold through promotion should not be treated as directly comparable to a food-service pack sold at standard terms, even when the headline percentages appear similar.
Use a repeatable sequence so a disappointing percentage leads to a cause and an appropriate decision, rather than an automatic price change.
Confirm the movement. Compare the SKU’s current margin with its own prior period and relevant benchmark on the same basis. State whether the measure is gross margin or contribution after channel-specific costs.
Separate selling price from manufacturing cost. Check discounts, rebates, returns, promotions, and customer mix before attributing the decline to production.
Bridge standard and actual. Review material rate and usage, packaging, yield, scrap, labor efficiency, overhead, and batch size where the underlying data supports that analysis. Avoid counting the same loss twice.
Trace the largest variance. Follow it to the affected receipt, ingredient lot, recipe version, material issue, production run, or sales transaction. Validate late or missing entries before acting.
Test whether it will persist. A single unusual batch differs from a continuing input-price increase, recurring line inefficiency, or a lasting change in customer terms.
Match the action to the cause. Consider repricing when cost or commercial terms have shifted structurally; review sourcing for material-rate changes; investigate production controls for recurring yield or scrap; adjust batch strategy when run economics are the issue. Reformulate only with quality, safety, regulatory, and customer requirements protected. Reassess a SKU if realistic improvements still do not support its portfolio role.
A lower-margin item may still be strategically valuable because of volume, capacity use, customer commitments, or its relationship to other products. The aim is to make that trade-off explicitly with a traceable explanation, not to apply a universal margin target.
It is the financial return associated with a defined finished product, measured on a consistent sales and cost basis. State whether the figure is gross margin, usually net sales less cost of goods sold, or a contribution measure that also includes selected channel costs.
Consider recipe ingredients, packaging, production labor, and appropriate manufacturing overhead, with yield and scrap treatment defined by the company’s costing policy. Relevant inbound costs may be included in acquired material cost; discounts and selling charges should remain identifiable in the commercial-margin view.
A formula change can alter material quantities, input mix, expected yield, or processing time. Keep effective versions and approvals clear, then compare each batch with the version actually used.
If comparable batch spending produces fewer good units than planned, cost per saleable unit rises. Investigate planned and actual output, expected loss, rejects, and rework before assigning the cause.
Standard cost is a benchmark based on approved assumptions. Actual cost reflects recorded activity under the chosen costing method and may be adjusted or finalized after additional transactions or period close.
They can monitor an indicative view using current purchase, production, inventory, and sales activity. Clearly label it provisional when invoices, overhead, landed charges, or production close are incomplete.
Separate net-price and channel effects from product-cost changes, then examine material price and usage, packaging, yield, scrap, labor, and overhead. Trace the largest variance to its source and validate the data before choosing a response.
Dependable food manufacturing cost and margin analysis is not simply a live percentage on a screen. It connects the SKU’s selling price to the recipe, inputs, packaging, production activity, yield, and cost rules that shape its economics. Finance and operations can then understand whether a variance is temporary or structural, and choose a response grounded in the cause.
Use the existing food ERP buyer checklist as an interim resource for assessing the underlying process and data requirements. A dedicated “Food SKU Cost and Margin Review Checklist” could serve as a future companion asset.
Discuss SKU-level food manufacturing cost visibility with Softype.


Helping businesses thrive with integrated ERP solutions.
NetSuite
Service
Company
Contact Us
Copyright © 2026


